Prediction markets, polls and surveys measure different things
Kalshi and Polymarket now trade billions a month, mostly on sports. Polls got more accurate in 2024 but still leaned one way. What each tool actually tells you.
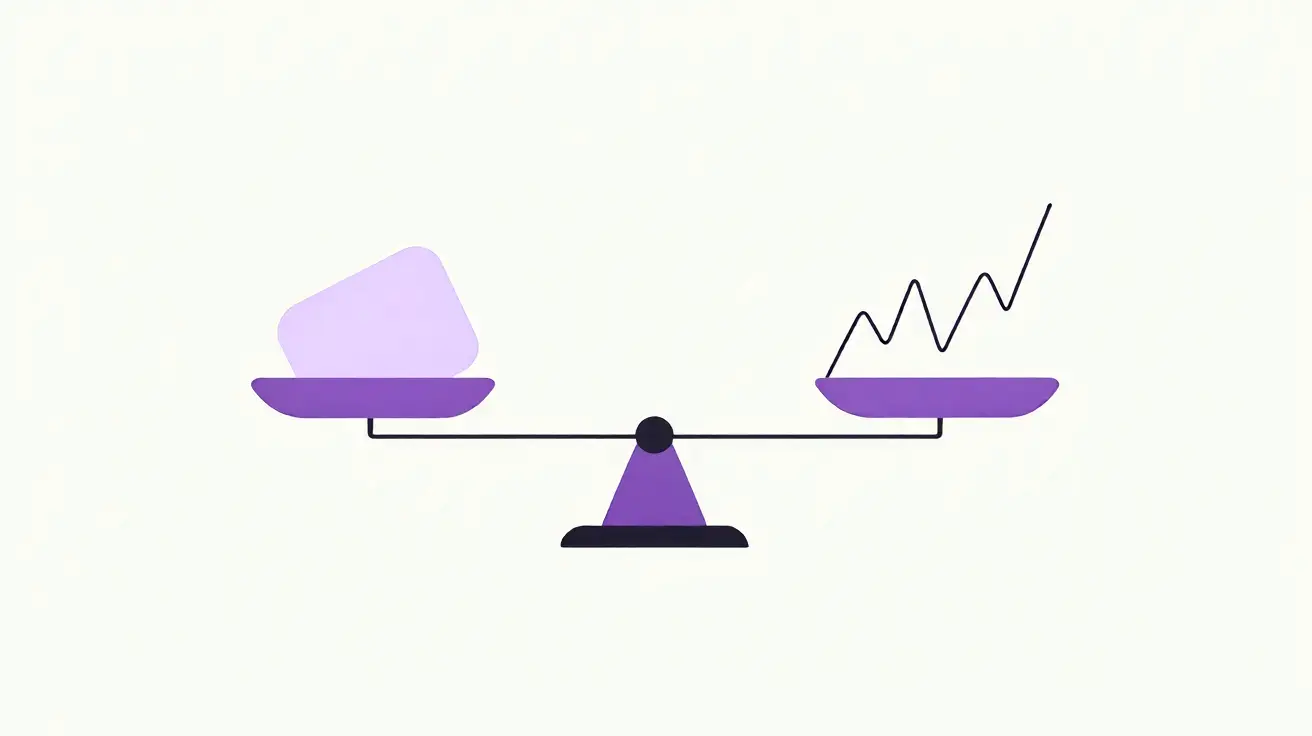
A prediction market tells you what traders expect to happen. A poll tells you what a sample of people say they will do. A survey tells you what people think and why. They answer different questions, and the mistake of the last few years has been treating one as a replacement for the others.
That mistake is getting easier to make. Prediction markets have grown fast, polling has had a mixed decade, and both are fighting for the same headline: “who is going to win?”.
How big are prediction markets now?
Very big, and mostly not about politics. Pew Research Center reported in May 2026 that combined monthly trading on Kalshi and Polymarket rose “from less than $5 billion in September 2025 to about $24 billion in April 2026.”1 In April 2026, “Polymarket US saw $1.3 billion in trading volume, compared with $9 billion on Polymarket International.”1
What people trade is revealing: “Sports has made up 80% of total trading volume on Kalshi and 39% on Polymarket since July 2024,” while “Politics has made up just 4% of total volume on Kalshi but 32% on Polymarket.”1 Most of this market is sports betting with a different legal wrapper.
That wrapper is now in court. In the US, Kalshi is regulated by the Commodity Futures Trading Commission, and Polymarket US is “newly regulated by the CFTC for American users.”1 On 13 November 2026, the CFTC sued Arkansas to stop the state from halting event-contract trading, and said “Arkansas is the 11th state the CFTC has sued.”2 Earlier that month, on 4 November, Arkansas’ attorney general had sued Kalshi, and Louisiana has since sued “companies including Kalshi, Polymarket, Robinhood, and Coinbase.”3
How accurate are polls, really?
Better than their reputation, with one stubborn flaw. The American Association for Public Opinion Research reviewed 611 polls from the last two weeks of the 2024 campaign and found that the average absolute error on the two-party margin was 3.3 percentage points, down from 5.3 points in 2020 and 5.2 points in 2016.4
The flaw: “For the third straight presidential cycle, pre-election polls underestimated Republican vote shares relative to Democrats’,” overstating Democratic margins by 2.7 points across all offices.4 The same report found no evidence that pollsters were copying each other’s numbers (“herding”).4
Part of the challenge is that fewer people answer. Pew reported back in 2019 that typical telephone survey response rates “fell to 7% and 6%” in 2017 and 2018, though its studies “found little relationship between response rates and accuracy.”5 Online samples replaced many phone calls, and brought their own problem, which we covered in our post on bots in online surveys.
So which one should you trust?
Neither, for everything. They measure different quantities:
| Tool | Measures | Good for | Weak at |
|---|---|---|---|
| Prediction market | Money-weighted expectation of an outcome | Fast-moving events with a clear resolution | Questions without a yes or no ending; thin markets |
| Poll | Share of a sample choosing an option | A snapshot of preference at one moment | Explaining why; reaching people who do not answer |
| Survey | Opinions, reasons and how they relate | Understanding a group and planning around it | Speed; needs careful design and a real sample |
A market price is not a measure of opinion. A trader can believe a candidate is bad and still bet that they win. A market also needs a question that resolves: “Will X happen by date Y?”. Most questions that matter to a business, a community or a researcher never resolve that way. “Why do people leave our app?” has no settlement date.
Markets also carry the mood of the money in them. In mid-November, CNBC reported that bitcoin “fell as low as $62,000 late Saturday,” coming off “its sixth weekly decline in a row.”6 Crypto-native markets trade inside that weather. A poll of real people does not move because a crypto chart fell.
Where do polls and surveys still win?
When you need to know what people think, not what they expect. Opinion questions (“Should our town ban cars from the centre on weekends?”) and design questions (“Which of these three onboarding flows is clearest?”) have no market, and should not need one.
That is the space Sibr works in: polls for a quick split, surveys for the reasons behind it, and paid studies with Pi-verified people when the sample has to be real.7 We find markets useful to read, and we expect people to keep asking each other questions directly.
Sources
-
Pew Research Center, short read on prediction-market trading volume, 27 May 2026. ↑ ↑ ↑ ↑
-
Commodity Futures Trading Commission, press release 9325-26, 13 November 2026. ↑
-
The Block, report on the DOJ and CFTC suit against Arkansas, 13 November 2026. ↑
-
AAPOR, Task Force on 2024 Pre-Election Polling, executive summary, October 2025. ↑ ↑ ↑
-
Pew Research Center, short read on telephone response rates, 27 February 2019. ↑
-
CNBC, report on bitcoin’s slide to $62,000, 16 November 2026. ↑
-
Sibr, sibr.online. ↑
Sibr
Have a question for real people?
Make a poll or a survey on Sibr in a few minutes, share one link, and watch the answers come in as charts. It is free to create and free to answer.
Open Sibr